Code Insights: Fix funky colors of insight data-series
Created by: vovakulikov
Closes https://github.com/sourcegraph/sourcegraph/issues/24683
Context
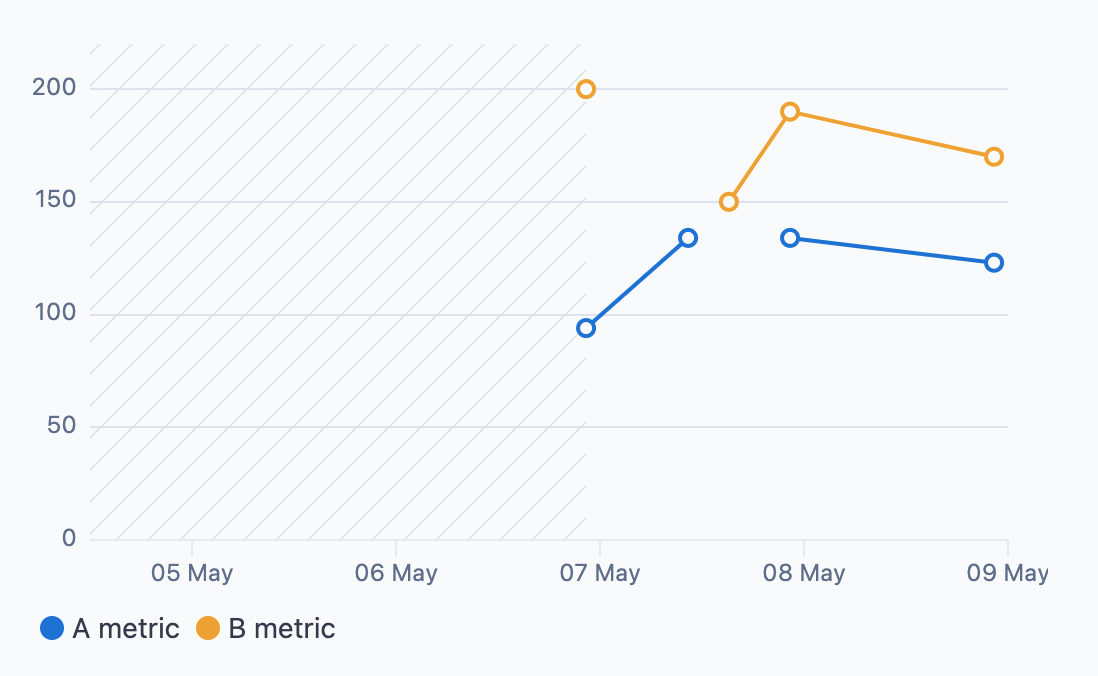
On main at the moment we have a problem with chart when two or more points don't have values for some time-x value when other point/points have values at this x point
[
  { x: 1588965700286 - 4 * 24 * 60 * 60 * 1000, a: null, b: null },
  { x: 1588965700286 - 2 * 24 * 60 * 60 * 1000, a: 94, b: 200 },
  // Datum below doesn't have b value but have a value
  { x: 1588965700286 - 1.5 * 24 * 60 * 60 * 1000, a: 134, b: null },
    // Datum below doesn't have a value but have b value
  { x: 1588965700286 - 1.3 * 24 * 60 * 60 * 1000, a: null, b: 150 },
  { x: 1588965700286 - 1 * 24 * 60 * 60 * 1000, a: 134, b: 190 },
]
So because our assumption about this case was wrong in the line chart code base (initially we thought that all points will have some values at some point at the time X-axis or neither of points has that value and therefore we don't have this point on the x-axis in the datum array at all).
But it turned out that this is the case cause for BE insights it's possible to have some values for one series and doesn't have value for other series at one particular point on the x-axis.
As a result, we have this visual behavior

Solution
This Pr adds the preparation step for the line chart data (datum list) and series configs. We convert this data
[
  { x: 1588965700286 - 4 * 24 * 60 * 60 * 1000, a: null, b: null },
  { x: 1588965700286 - 2 * 24 * 60 * 60 * 1000, a: 94, b: 200 },
  // Datum below doesn't have b value but have a value
  { x: 1588965700286 - 1.5 * 24 * 60 * 60 * 1000, a: 134, b: null },
    // Datum below doesn't have a value but have b value
  { x: 1588965700286 - 1.3 * 24 * 60 * 60 * 1000, a: null, b: 150 },
  { x: 1588965700286 - 1 * 24 * 60 * 60 * 1000, a: 134, b: 190 },
],
series: [
 { dataKey: 'a', name: 'A metric' },
 { dataKey: 'b', name: 'B metric' },
],
into this
series: [
  { dataKey: 'a', name: 'A metric', points: [ {x, y}, {x,y} ... ] },
  { dataKey: 'b', name: 'B metric', points: [ {x, y}, {x,y} ... ] },
]
Each series now has its own datum list (points array) we process this array and remove null/undefined gaps between points but preserve nullish data at the beginning for the non-existent points patter (line background) Also because in this case, not all series may have all points at some x-axis value it's possible to not have some chart value in tooltip info. See screenshots below
| With a and b series values | With one series missing value |
|---|---|

|

|
Work in progress
- Add unit tests to the
getProcessedChartDatafunction - Probably change other logic for data preparation and move away from datum reach list to the series datum instead.
- Create a separate story for this case