Charts: [Line Chart] Stacked series are stacked and rendered wrong if series don't share same x coordinate
View options
Created by: vovakulikov
In case when series are not aligned between each other (grouped) by x-axis values, we have unaligned and wrong stacked series on the chart.
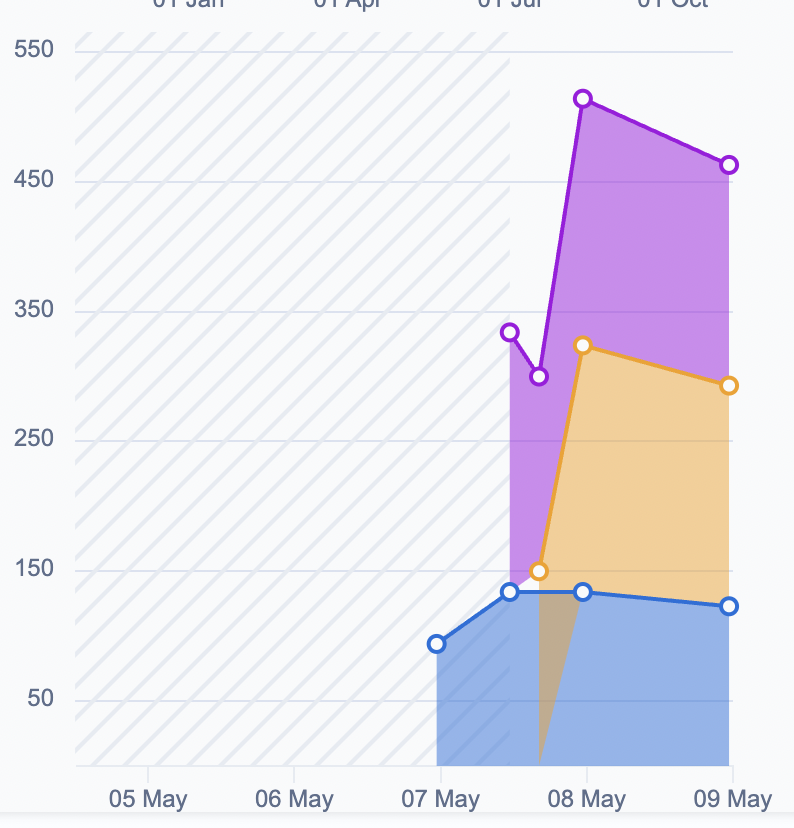
Mock data from the picture
 const DATA_WITH_STEP: DatumWithMissingData[] = [
        { x: 1588965700286 - 4 * 24 * 60 * 60 * 1000, a: null, b: null, c: null },
        { x: 1588965700286 - 3 * 24 * 60 * 60 * 1000, a: null, b: null, c: null },
        { x: 1588965700286 - 2 * 24 * 60 * 60 * 1000, a: 94, b: null, c: null },
        { x: 1588965700286 - 1.5 * 24 * 60 * 60 * 1000, a: 134, b: null, c: 200 },
        { x: 1588965700286 - 1.4 * 24 * 60 * 60 * 1000, a: null, b: 150, c: null },
        { x: 1588965700286 - 1.3 * 24 * 60 * 60 * 1000, a: null, b: 150, c: 150 },
        { x: 1588965700286 - 24 * 60 * 60 * 1000, a: 134, b: 190, c: 190 },
        { x: 1588965700286, a: 123, b: 170, c: 170 },
        { x: 1588965700286 + 24 * 60 * 60 * 1000, a: null, b: 200, c: null },
        { x: 1588965700286 + 1.3 * 24 * 60 * 60 * 1000, a: null, b: 180, c: null },
    ]