Admin Analytics: Click and drill into charts
Created by: mike-r-mclaughlin
Requested by: https://github.com/sourcegraph/accounts/issues/3
Feature request description
It would be nice to be able to click on a data point and drill down into the data to see the actual list.
Example
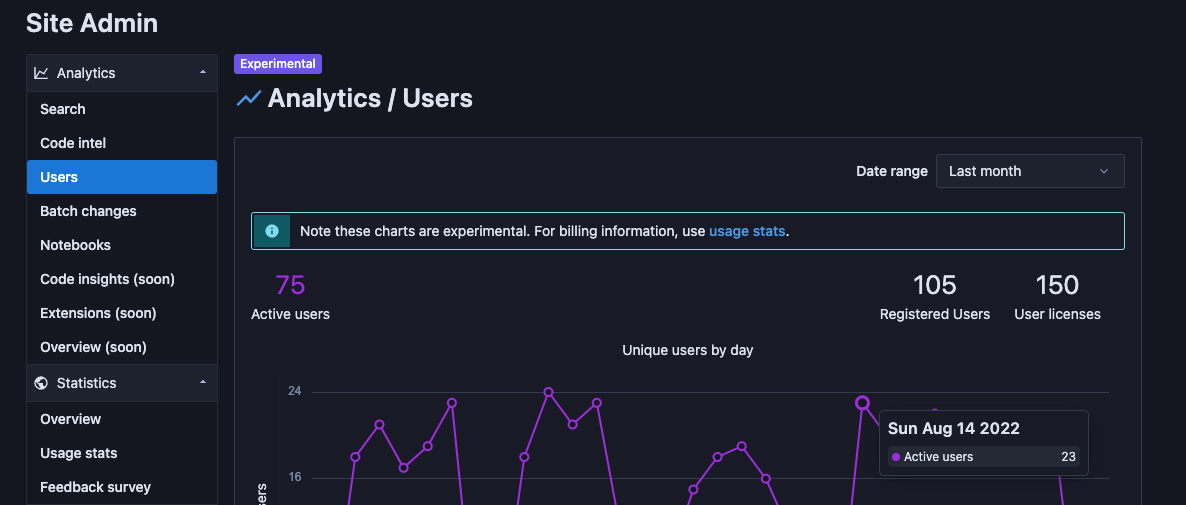
For example, in the image above, it would be nice to click on the "23" data point and see the list of 23 users. In this case, the admins would like to know who was using Sourcegraph a day after the training.
Is your feature request related to a problem? If so, please describe.
After a training session, team leaders or admins are interested to know who are the early adopters. In another example, admins would like to know who are the "power users". They imagined looking at the data across several time periods to get this data; however, it might be better if this were included as a separate chart entirely.