Code Insights: Support series color for compute-powered insight series
Created by: vovakulikov
Depends on https://github.com/sourcegraph/sourcegraph/issues/39162
Background
In the first release of compute we release series with no manually set colors and use generated on the backend series results and colors simular to the capture group insight. This is because we can't connect series with series points in case of generated series point on the backend in live preview handler searchInsightPreview.
For example let's say we have insight with 2 series "compute" and "insight" in searchLivePreview query we have
[
    {
        "points": [ { "dateTime": "2022-07-14T17:25:28Z",  "value": 8,  } ],
        "label": "Rijnard van Tonder",
    },
    {
        "points": [ { "dateTime": "2022-07-14T17:25:28Z",  "value": 6,  } ],
        "label": "leo",
    },
    {
        "points": [ { "dateTime": "2022-07-14T17:25:28Z",  "value": 8,  } ],
        "label": "leo",
    },
    {
        "points": [ { "dateTime": "2022-07-14T17:25:28Z",  "value": 10,  } ],
        "label": "Vova Kulikov",
    },
]
As. you can see, this is just a flat list of points, and the best that we can do here is just group this flat list by label and sum up the points of this group. In this example, we would have 3 bars on the bar chart with
- Rijnard van Tonder with 8
- leo with 6 + 8 = 14
- Vova Kulikov with 10
But we can't determine which colour we should use at which point in which series based on GQL response. And this is a problem
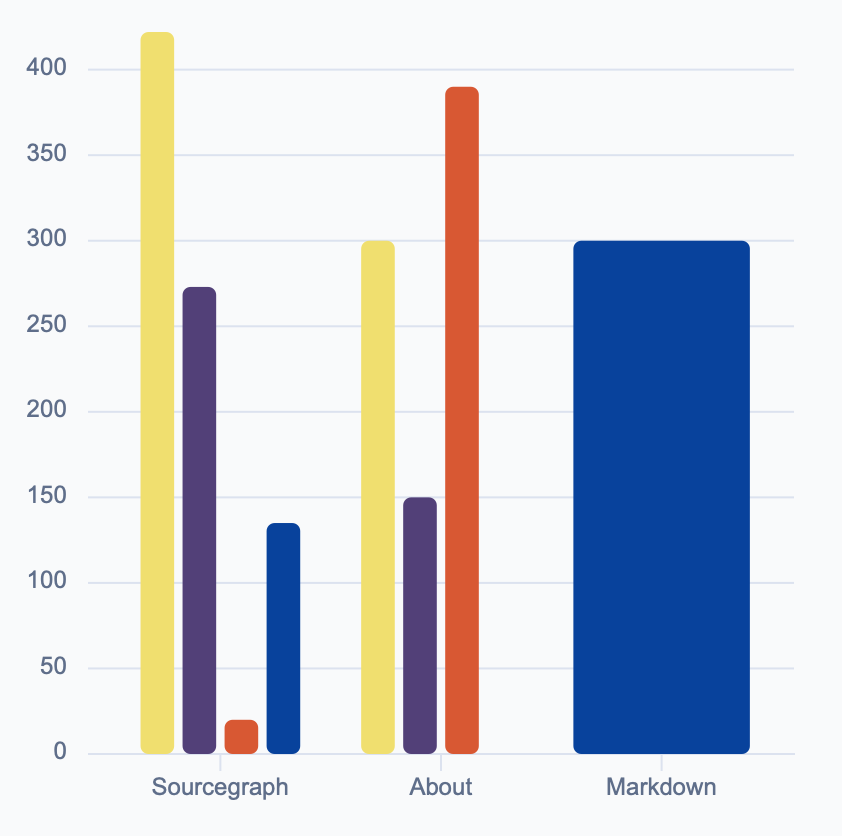
Ideally, we want to split results from different queries and colour them with series colors, for example, like on the following chart below.