Code Insights: Sometimes number of Y axis ticks might be not optimal
Created by: vovakulikov
Background
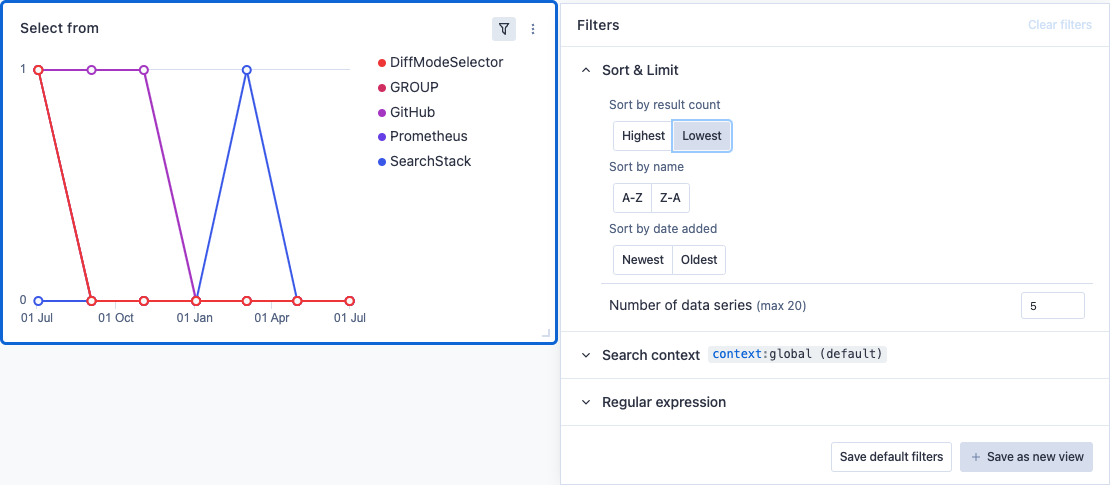
In case we have a dataset that has only points from two values (like on the picture below, 0-1) we render charts with a weird (just 2) number of ticks.
Expected behaviour
Render chart with a minimal number of ticks (for example, 5 ticks minimum)