Metrics, dashboards, and alerting export tracking issue
Created by: bobheadxi
Our firm stance at the moment that custom metrics/alerting backends are not supported: Can I consume Sourcegraph’s metrics in my own monitoring system (Datadog, New Relic, etc.)?. This is a significant product gap.
The situation is historically because our monitoring components are highly customized:
- Dashboards and alert rules are generated by the monitoring generator and are not easy to export, and are heavily tied to Grafana/Prometheus
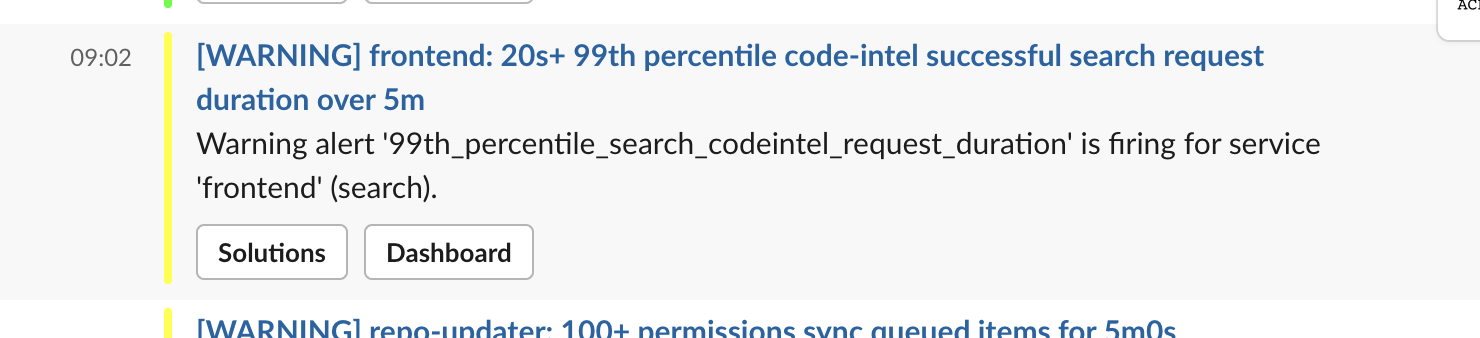
- Alerts are delivered by a bundled Alertmanager deployment that is operated by an embedded service called prom-wrapper, which integrates with Sourcegraph site configuration to apply alert settings and deploy highly customized templates tailored to alert rules:
To detach all this, some general ideas would be:
- Identify what custom Prometheus configuration we apply, and how to generalize metrics export for other o11y backends that remain compatible with our dashboards and alert rules
- For example, executor observability configuration
- Identify how to generalize dashboard generation for other o11y frontends
- Identify how to generalize alert rules generation for other o11y backends
- Identify ways to make the alerting integration via prom-wrapper optional/seamless to detach