Code insight charts may have weird negative y-labels
Created by: vovakulikov
Steps to reproduce:
- Go to code insight charts
- Notice that some charts have strange negative y-labels. (see image below)
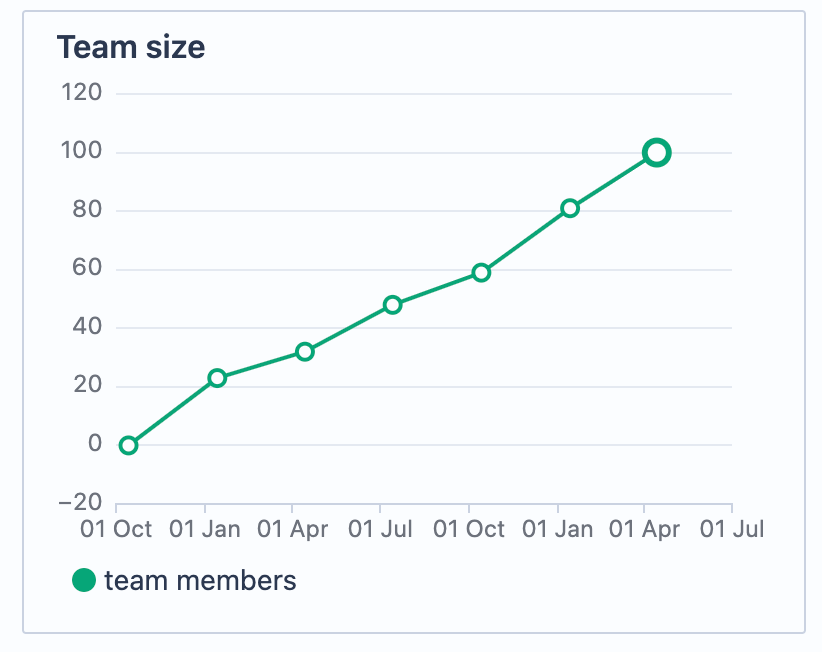
Expected behaviour:
For some charts we have to clamp first lowest y value by some number (In the case in the picture above, we should limit the lower Y bound to zero)
Actual behavior:
Having a negative value in charts where it doesn't make any sense.